


If you would like to receive weekly updates like this, sign up here.
An interesting survey recently shed some light on the different housing and urban density habits of a host of modern western economies.
I feel this is an important study on many levels. This is why.
Not only does it provide evidence of the different views held across these different countries surveyed, but it also gives us some valuable clues as to precisely what type of residential properties will drive future growth.
If you are a property investor, I believe being aware of this fact would prove quite a lucrative edge for you.
Because if this study is even remotely correct, the differing attitude between those who favor detached housing compared to those who favored attached dwellings depends on whether you speak English as your native tongue!
Sounds amazing to say, doesn’t it?
Let’s take a further look into this survey, the findings it produced and most importantly for you, how it produces even further evidence of how and why the current 18.6-year Real Estate Cycle is going to be the biggest ever.
And depending on your native tongue, it might even help you with your next property purchase.
Let’s dive in.
How speaking English makes you richer.
Firstly, let’s look at the rationale behind the survey. It was conducted by YouGov, a British internet-based market research and analytics company. They run polls in many countries across Europe, the US, Australia, the Middle East, and Asia.
In this survey, they wanted to understand the housing shortages, unaffordability, and prevailing attitudes to housing from across the above geographic areas.
Now, some of the survey results were subsequently charted.
They are bit heavy on details, but the trend they show is enlightening.
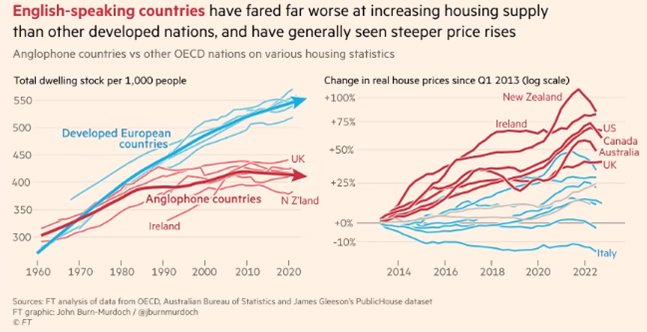
Source – FT
Basically, take note of the red and blue colored trend lines. Developed countries where English isn’t their native tongue are blue, English-speaking nations are represented via the red line.
The left chart shows you the trend in housing supply, whilst the right chart shows change in house prices from 2014.
You can see on the left that the blue line is much higher than the red, whereas on the right it’s the opposite.
Forty years ago, the UK, US, Canada, Australia, New Zealand and Ireland had roughly 400 homes per 1,000 residents, level with developed continental European countries. Since then, the two groups have diverged, the Anglosphere standing still while western Europe has pulled clear to 560 per 1,000.
This has affected relative house prices as the chart on the right clearer shows.
The other aspect of this is the survey tried to capture what each country ‘thought’ about what a home means and what their historic preferences are.
There appears to be a deep-seated aversion to urban density in the Anglospehere that sets these countries apart from the rest.
The survey believes there are three distinct factors are at work here.
The first is a shared culture that values the privacy of one’s own home — most easily achieved in low-rise, single-family housing.
The phrase “an Englishman’s home is his castle” dates back several centuries. From this came the American dream of a detached property surrounded by a white picket fence, while Australians and New Zealanders aspired to a “quarter acre”.
A new follow-up YouGov survey bears this out: when asked if they would like to live in an apartment in a 3-4-floor block — picture the elegant streets of Paris, Barcelona or Rome — Britons and Americans say “no” by roughly 40 per cent and 30 per cent respectively, whereas continental Europeans are strongly in favour.
Source – FT
And it’s not just living in these apartments that Anglophones don’t like. Almost half say they would oppose new 3-4-storey blocks in their local area, whereas in every European country surveyed most would be in favour.
Across developed countries, 40 per cent of people live in apartments, and the EU average is 42. But that plummets to 9 per cent in Ireland, 14 per cent in Australia, 15 per cent in New Zealand and 20 per cent in the UK.
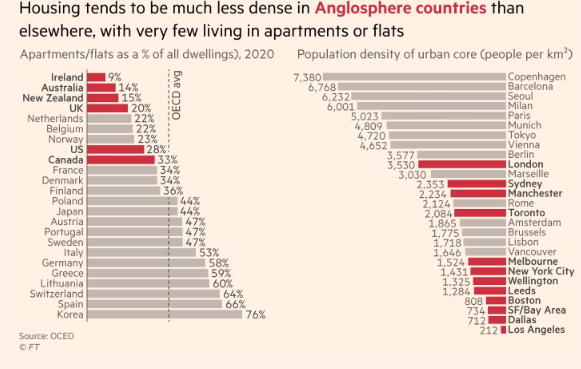
Source – FT
Now, the survey results also pointed out the issues in regards different planning processes and the way property development applications are treated but they are outside the scope of today’s newsletter.
And here’s why.
There are clues hiding in plain site for those of you who research the 18.6-year Real Estate Cycle.
These results can show some light on ‘why’ the real estate cycle is so volatile and moves from boom to bust. And it also gives you valuable clues as to precisely what your next investment property should be.
Here’s the secret to winning the land game.
It seems to me that the prevailing attitude is probably something that gets handed down from one generation to another.
If your parent lived in apartments, and they raised you in one too, I suppose there would be an affinity towards that style of living. Perhaps the fact the apartment allowed you to live in the middle of a bustling city – where everything you could ever need was only a few steps outside – has strong appeal?
So identifying and then purchasing a apartment in downtown Madrid might turn out to be a good decision. Certainly, you’d expect, if these surveys results are any guide, to have plenty of like-minded tenants who value the locational flexibility of inner city living?
Whereas in Australia or Ireland, a more traditional detached dwelling is what most future property buyers aspire to own.
Of course, it all sounds so obvious, but don’t discount it when you find corroborating evidence to support the prevailing view.
For me though, what’s more important than all of that is the following: what this tells me about the 18.6-year Real Estate Cycle.
Three of the biggest real estate markets in the western world are the US, the UK and Australia.
In the final quarter of 2022, the Australian Bureau of Statistics estimated the total value of residential real estate in the country at over A$9 trillion.
The single most sought-after piece of residential land in the market today is a detached home with a large backyard. They are also on average the most expensive for that reason.
This survey suggests something similar for the UK and US too.
So, in order to buy one of these most families will need to approach a bank. Which means they will then need to be asking for, and then servicing for the next 30 years, the biggest average mortgages in the country by size.
The PSE property clock on our website informs you that we are currently sitting at 1300 (1pm). This denotes its time for a global land boom.
The world will need a whole lot more credit creation today than it needed even two years ago.
Can you see how these things are driving one another?
More credit creation will now be necessary to allow families in the US, UK and Australia to be able to outbid each other for the perfect property type for a family.
All this ends up in the price of land, requiring even more credit to bid.
Those who own detached housing quickly realize they have a huge advantage relative to the market.
They have the space to make renovations and improvements to their property to make it even more desirable to own.
Normally, the equity of the property is used via a refinanced loan to pay for the improvements. More credit.
Now the same bank will revalue the property higher, the owners can now if they choose list for sale.
They will attract the bulk of buyers because, as this survey seems to suggest, potential buyers do not want to live in apartments.
And so, the sellers bank the capital gains once they do sell, or not.
This. Is. The. Real. Estate. Cycle.
While SVB bank blew up and the world’s media raised hell reporting it, all over the world this simple act of buyers meeting willing sellers was going on regardless.
This is, in one way, the ground floor of the cycle. The fundamental heart of why the real estate cycle continues to turn.
As for the YouGov survey and results, for mine it added a little more confirmation of the above fact. A different slant on the attitudes and behaviors across many countries.
Are you thinking of buying your first home, or upgrading? Maybe your first investment property is more aligned with your immediate goals?
We are fast approaching the end of the first quarter of 2023. In a few years’ time, the top of the US land market will be in.
If you don’t act now, you’ll find yourself buying at the absolute worst time possible!
What will really help you however is the guidance and knowledge a membership to the Boom Bust Bulletin will provide you. Give me the opportunity to take you in depth into the cycle.
Learn about the over 200-year history of the 18.6-year Real Estate Cycle and why even today it continues to repeat like clockwork.
It will teach you how to decipher the news that we get bombarded with every day to focus solely on what truly matters.
No more negativity and noise, just the science of the economic rent and the timing inherent in the real estate cycle.
This is all you need to succeed.
Our property clock has many key milestones on it that allow you to time the cycle as it turns. There is a section of the clock that identifies “the winners curse”.
Almost without exception, it represents the absolute high water mark for property values.
Buy here, and you’ll find yourself underwater very soon after as the peak turns into a bust.
You simply must not be heavily leveraged at this time; you’ll likely never recover from it for the remainder of your life.
If you want to avoid such a fate, then it begins with your education.
As a Boom Bust Bulletin member you will receive 12 monthly editions a year detailing all the key turning points of the cycle, a deep dive into the most important markets across the globe and ways that you can personally benefit from this knowledge.
All derived from our unique and proprietary research – which you’ll not find anywhere else.
Plus, you’ll receive exclusive invites to BBB member-only webinars when we run them.
All this for just US $4 a month, less than a takeaway coffee.

Best wishes,

Darren J Wilson
and your Property Sharemarket Economics Team
P.S. – If you would like to receive weekly updates like this, sign up here.
P.P.S – Find us on Twitter here and go to our Facebook page here.
This content is not personal or general advice. If you are in doubt as to how to apply or even should be applying the content in this document to your own personal situation, we recommend you seek professional financial advice. Feel free to forward this email to any other person whom you think should read it.