

If you would like to receive weekly updates like this, sign up here.
So, how are you finding the year-to-date market action so far?
“Pretty interesting” isn’t the half of it!
I had the opportunity to catch up with some members of Property Sharemarket Economics (PSE) during our face-to face meetings run in Adelaide.
I recall mentioning to a few of those same people my two favorite words to describe the rest of the decade.
Those two words are “frenetic” and “emotional”.
You should remember those two words as we traverse the rest of 2022.
They are important because, when it comes to the market, you absolutely must not bring either with you when it comes to the daily grind of the share markets.
Particularly in the context of a world swirling with high inflation, conflict and gyrating bond markets.
Today, I’d like to share with you a sneak peak of what I’m doing right now amongst the carnage we are going through in the markets.
And, at the same time, show you a tool which almost 99% of investors and traders today do not have at hand.
How you can find out where you are, and where you are going?
Every day I have to deal with markets and my investements I’m grateful for the knowledge the 18.6-year Real Estate Cycle gives me. Its thanks to this knowledge that I learned one of my most valuable lessons.
I learned how to be patient.
If you can rely on history and the science of the economic rent, then it’s possible to rise above the noise and know with clarity what to expect next.
The economic rent is the natural rent generated by a productive society that ends up being captured by the land. A gift to all of us.
Until we allowed banks to collateralize and lend against land for the benefit of those who could afford it.
Nonetheless, by understanding this dynamic you can certainly turn it to your own advantage.
But a little extra help doesn’t go astray either.
When it comes to the stock market, I’ve found the PSE Stock market Roadmaps produced by Phil Anderson and Akhil Patel a vital resource.
Each year, Phil and Akhil get together around November and put together a forecast for stock market over the following year.
You won’t find a document like this anywhere else.
This is because Phil and Akhil use the same techniques that legendary trader W.D Gann used to create his own forecasts for his paid students every year.
Gann was one of the greatest traders of all time, who combined world class chart reading, cycle and geometric research to create life-changing profits for himself and his students.
It is this man’s teachings that underpin the PSE Stock market Roadmap.
Forgive my lack of modesty, but I think PSE improved upon it.
That’s because, as far as can be ascertained, Gann himself did not have any awareness or knowledge of US cycle based on real estate.
Therefore he could not put the markets in the context of where we are in the real estate cycle, how credit and public spending fits in and all the other features of the real estate cycle that help us tell what might be coming next for the economy.
Let’s talk specifically about the 2022 edition of the stock market roadmap.
It contains forecast curves for the US, UK and Australian markets.
The Roadmap sets out where we are in the 18.6-year Real Estate Cycle. This is something only PSE can provide you by way of setting out the market context.
We have stated many times to you here that the current cycle has left its mid-cycle recession period and is now well into the start of the second half of the cycle.
The second half of the cycle involves credit creation in abundance by banks. Allied to low interest rates and government still in stimulus mode this means that we are very unlikely to forecast a collapse in the coming year, despite what is in the news (and let’s face it, the news has been terrible this year).
We then overlay this knowledge over the markets, especially the Dow Jones (because we have the longest price history for that; as Gann himself said: the further back you look, the further forward you can see).
We have other cycles and patterns we look at and apply. Putting together a document like this – a forecast for the market in advance – is not an exercise Phil and Akhil take lightly.
It takes many weeks of work and discussion to get their thoughts down. And this is based on over three decades of study and research about markets and market cycles.
But here are the results.
Results that speak for themselves.
 Source: Property Sharemarket Economics
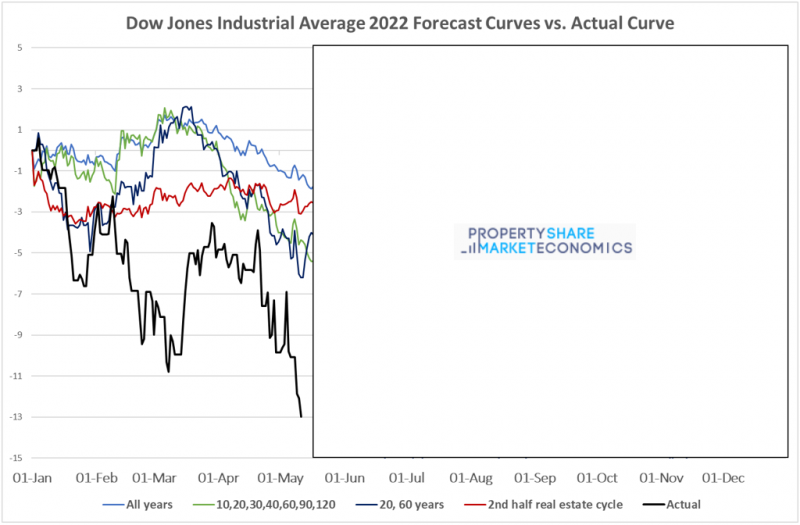
Above is the actual Dow chart straight from the 2022 roadmap.
The team usually puts together a few separate forecast curves (the green, light, blue, dark blue and red lines). They usually point in the same direction but some have more aggressive moves than others.
Which one the market will actually follow in the event is not so easy to forecast in advance. And it raises a key point: forecasts are simply just forecasts.
You trade the market based on actual price action. Hence the need to allow for a range of possibilities.
Phil and Akhil provide regular commentary on market action to track the price action in real time and to alert subs if the forecast might be awry (it does happen occasionally: nothing is ever easy in the markets).
But the key point from all this: at the end of last year, as markets were charging upwards our forecasts were for the markets to peak and fall into the middle of the year. I don’t think you’d have seen anyone else saying that.
And recall that this was well before we’d even considered that Russia might be about to invade Ukraine or that the West would retaliate by attempting to cut Russia out of the international trading system.
In the chart above, the black line is the actual performance of the Dow overlaid on the forecasts.
The price action has been more negative than the forecast but the direction and time frame has been pretty spot on.
There is plenty of other amazing insights in the Roadmap. It’s truly a remarkable document.
Here’s where the rubber really meets the road. Our PSE members had this document in hand in January this year.
So they were prepared and were aware of what they needed to look out for. They also benefitted from regular emails from Phil and Akhil which guided them throughout the year so far.
Did you know that 2022 would be as volatile as it has been this year?
I do know this. We have roadmaps just like the Dow for the NASDAQ, the UK FTSE and the All Ordinaries in Australia. Each one of those charts suggests there are 2 major turning points across each market between now and the end of the year.
Do you think it may benefit you to have prior knowledge of when they might happen?
Take a moment to look at the markets right now. Even if you don’t have a single cent in the markets personally, your Superannuation (or 401K in the US) balance is currently a lot lower than it was on January 1st this year.
If you want to be prepared for the remainder of what is an important year and need to know what’s coming next, there’s only one way to get the full Roadmap.
You’ve simply got to become a full PSE member. It’s the only way to get this information.
I’ve no doubt you’ll need the kind of guidance, advice, and research that PSE can offer now more than ever.
And our Stock market roadmap for 2022 is your best tool for navigating the volatility our research of the stock and real estate markets suggest.
Don’t wait any longer, get your true market advantage today.
Simply click here.
Best wishes,

Darren J Wilson
and your Property Sharemarket Economics Team
P.S. – If you would like to receive weekly updates like this, sign up here.
P.P.S – Find us on Twitter here and go to our Facebook page here.
This content is not personal or general advice. If you are in doubt as to how to apply or even should be applying the content in this document to your own personal situation, we recommend you seek professional financial advice. Feel free to forward this email to any other person whom you think should read it.