

If you would like to receive weekly updates like this, sign up here.
I want to address the current debate concerning Australia’s property market.
I have never witnessed such dissonance between the reporting on this subject and the facts as they appear on the ground.
Never.
There is just so much going on behind the scenes here. It would take a book to address the facts, the propaganda, vested interests, and naked emotion this subject is generating right now.
I can’t do that all in just one newsletter. So, I will make this a series of newsletters diving head on into this subject.
Today’s newsletter marks the first of these. I will cover other parts of this evolving story in future newsletters for you.
If global land markets really are beginning their push towards unheard of highs later this decade, are there clues to this set up happening today?
The financial media aren’t interested in telling you, not that they know where to look.
Together, we must roll our sleeves up and do the detective work ourselves.
And start to piece it all together. Let’s start by examining the top articles out there, what they are saying, and then apply the lens of the real estate cycle to garner the truth.
Let’s find out now what’s ‘really’ happening on the ground.
What’s really scary about the housing market today?
You don’t know sometimes whether to laugh or cry.
Maybe do both?
What do I mean? Take a look at the below image
Source – FT
It was a challenging year for active managers in European equities…recording its highest annual underperformance rate.
From the opening paragraph of the above article.
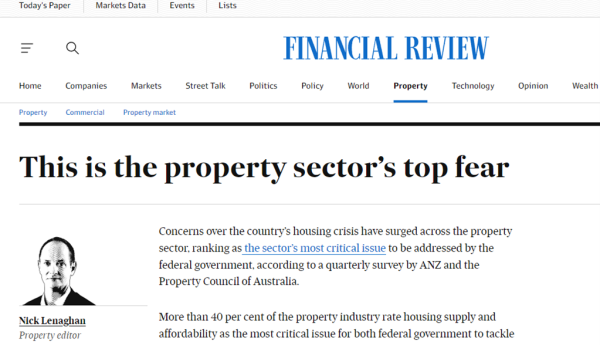
Concerns over the country’s housing crisis have surged across the property sector, ranking as the sector’s most critical issue to be addressed by the federal government.
See what I mean. Once again, the call goes out for the government to do something, anything, to save the day.
Folks, anytime the government enters a free market where willing buyers meet willing sellers and engage in price discovery spells trouble. Simple as that.
Then again, ask yourself who is asking for this type of assistance?
It’s the property lobby.
They convey their wishes via the financial media. Just like the above. From the article.
“There’s essentially a crisis in the rental situation,” ANZ senior economist Felicity Emmett told The Australian Financial Review. “House prices are now rising because of a lack of supply. It’s been decades in the making.”
“We really do need to see some movement on this by policymakers at all levels of government.”
“It shows you that what is happening out there on the ground is really a perfect storm,” PCA chief executive Mike Zorbas said.
“There is a huge challenge, particularly on the eastern seaboard, where premiers and treasurers and planning ministers are yet to grasp the enormity of the issue: rising population, return of students, lack of supply, lack of new build in apartments, lack of detached house builds. [They are] failing to grasp that reality and therefore, the need is spiking and urgent. There’s no bigger challenge.”
Sounds dire, doesn’t it?
On the surface, it looks like a perfect storm of events have all coalesced here into a major crisis.
From a significant and sustained interest rate rising campaign by central banks across the globe, to rising inflation impacting bottom lines for companies that already had to tolerate fine margins (home construction companies being one such) to a lack of supply both new and existing.
Then add a mandated (here in Australia) government policy of sending immigration and international student visas into overdrive.
As I mentioned, it presents as an almost insurmountable set of problems to overcome.
If you ask me, you start with two simple but effective tools. One is something we ‘should’ all possess, though I do wonder at times.
That’s common sense.
The second one isn’t as common. It’s the 18.6-year real estate cycle lens.
We shall use both today to make some sense of all this.
The kind of help you’re better off not receiving.
Let’s review what the so-called experts have said. I shall paraphrase some of the aforementioned quotes. The bold parts are my own.
“House prices are now rising because of a lack of supply. It’s been decades in the making.”
Um, yes and no.
The land market really is all about supply and demand, so yes, Felicity Emmett got that right. But decades in the making?
A bit hyperbolic for me. “We really do need to see some movement on this by policymakers at all levels of government.”
Excuse me?
I think we’ve seen more than enough of that by policymakers, thank you. How so?
Have a close look at the below chart from CoreLogic, one of Australia’s largest depositories of home price & lending data.
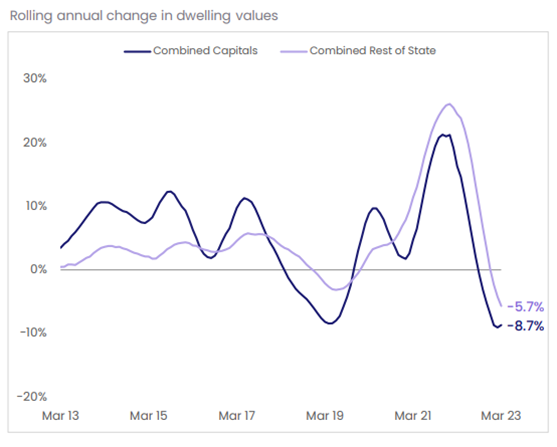
Source – CoreLogic
This chart shows a 10 year rolling annual change in all dwelling values across Australia. Can you see, anywhere on that chart, a abnormally high price curve followed by a equally abnormal fall?
Funny enough, it coincides with the 2020 covid lockdowns and subsequent reopening of the economy.
This is your movement by various policy makers across all governments.
Prior to 2020, you can see the 10-year movement up and down in a relative +10%/-10% range typical of how the Australian market moves. Some capital cities will see avg. 5%+ growth over any given 12 month period and some will see avg. -5% or more drop in prices.
Speaking very generally here.
From 2013 to 2017 price growth was in the postive for most of Australia. Then the two biggest cities in the country, Sydney and Melbourne, had a long overdue pause in price growth. Expressed as a average, this brought the combined price chart down.
Then we have what most call the covid lockdowns. The real name for it was the mid-cycle slowdown or recession. This is the edge that knowledge of the real estate cycle gives you.


The PSE team knew this was going to happen, years in advance. The covid related lockdowns simply represented the symptoms, it wasn’t the true cause.
Rarely if ever have we witnessed in any prior mid cycle slowdown in recorded Australian history such a deliberate dislocation of a free market via direct governemnt intervention and policy decisions.
Recall massive amounts of stimulus injected into a dormant economy. Almost 10% of total GDP ($190 billion). You were told it was to help replace lost income for millions who now had no job with the country basically closed for everything but the most critical industries.
That payment was called Jobkeeper, a payment the government made to respective employers to replace lost income for full-time employees as the economy was shut down. The amount was initially $1500 per fortnight.
Where did they get that figure? Did the government pull it from thin air? No. They liaised with Australias biggest banks. Why? Because they had the majority of mortgage data of their customers.
That figure ensured the banks would still have the overwhelming majority of their home loans continued to be serviced.
Jobkeeper was specifically designed to support the land market.
Not that you will ever be told as much.
And it did, as the chart shows. But as that stimulus was unwound and the economy reopened, the inevitable fall for prices duly arrived. By artificially pushing land prices for existing homes higher in this manner the fall will be equally violent and overextended.
Decades in the making? Hardly, this was over a period of a few years.
Hundreds of billions of stimulus to bring the property market right back to where it was in late 2019, before a single cent of taxpayers money was spent.
(Round of applause).
And now, these same ‘experts’ expect the government to fix a problem that was their own making in the first place?
This sentiment change can only mean one thing.
Here’s my contention: we don’t need anymore government direct intervention in the property market.
Now, I’m not saying there is or will be zero involvement. Recently property lobby groups have approached regulators about lowering the key benchmark for mortgage servicability mandated by APRA (Australian Prudential Regulatory Authority) down from its current 3% level.
This is how mortgagees ability to service their loans are calculated by banks. Lowering the benchmark means it’s easier to secure a loan. For now, the request has been denied but the debate continues.
Whats required is for the market to adjust and use the magic of price discovery to get this countries current lack of supply fixed organically.
And know that the nations banks are willing and able to kick start this.
The current price for money is 3.6%. Thats todays offical cash rate. Historically in Australia the cash rate has been around 5% p.a. We are still short of this historical average. But on this front things are slowly returning to normalcy.
The abnormal state of affairs was a decade of below average, and then effectively zero, interest rates.
We have seemingly forgotten what ‘normal’ actually is.
It was the journey to here, the incredibly rapid and sustained rises, rather than the destination that told the story.
But we are here now. So whats the true story at ground level?
 Source – AFR
Bank competition for mortgages is bringing more stability to the housing market as investors and homeowners able to secure a lower variable mortgage rate – without even changing lenders – are reducing the risk of forced or cut-price sales.
Increasing competition by lenders is another sign of recovery building in the residential market emerging from the hit of 10 straight interest-rate rises and suggests Australia may be able to avoid widespread distress of forced sales and slumping values.
Interesting no? And the focus of this lending, right now, is also telling. Its exsiting home owners and investors. No-one wants to be placed in a position to make a forced-sale. The prudent thing to do is to sit and wait for the economy and property market to change sentiment.
This has meant a severe lack of existing homes listed for sale on the market.
Bad for prospective buyers-yes. But, good business for the banks, thanks to this refinancing binge. Don’t need to spend thousands advertising for clients you already have.
The number of residential properties nationally selling under distressed conditions rose by 5.1 per cent to 6220 in March, still less than half the 13,000 average distressed listings recorded before the pandemic, according to SQM Research data.
There are 9.8 million homes in Australia according to 2021 census data. Divide 6220 by that number to find the number of distressed properties as a % of all homes.
We all need to move on from that narrative don’t you think?
The banks don’t have any worries about mass foreclosures, they are instead right in the middle of a campaign to increase their market share. Lack of financing for new construction (a topic we will cover in the future) means the focus is instead on existing homes.
Are there further clues then about a change in sentiment on the ground?
Are these owner-occupiers and investors feeling more bullish about re-entering the markets? Are there signs that the buyers are back in charge?

Source – AFR.
Auction clearance rates have jumped, hitting 72 per cent in Sydney, as listings doubled nationwide, with buyers taking heart from a pause in rate increases and signs the market has bottomed in the biggest markets.
The stronger numbers defied the normal season trend over the Easter break and school holidays, when clearance rates typically dip.
In our nation’s two most important markets, Sydney and Melbourne, the signs point to a swing in sentiment to the positive side. The influx of new migrants and students simply adds more impetus to “get in now.”
And it’s no coincidence that as soon as official interest rates were paused the banks made their move.
Uncanny, it’s almost like the RBA and the banks were, you know, colluding all along (!!!).
SQM director Louis Christopher was asked in the above quoted article about his thoughts behind the increase in clearance rates. Below is some of what he said.
“They are a combination of first home buyers as well as new arrivals into the country,” he said.
“There is a rental crisis. Many renters out there have had enough of the rental market, in terms of trying to find a rental property and competing for it. But up until now, there has been less competition in the for-sale market.”
Gross rents rise = net rent rises = cheaper to buy than rent.
A key combination highlighted on PSE’s proprietary property clock.
So, are you feeling that the markets turned now? Are you perhaps more confident in buying your first home or adding to your investment portfolio?
Either way, a little knowledge can go a long way to help you. Start here via a membership to the Boom Bust Bulletin (BBB). Give me the opportunity to take you in depth into the cycle.
Learn about the over 200-year history of the 18.6-year Real Estate Cycle and why even today it continues to repeat like clockwork.
It will teach you how to decipher the news that we get bombarded with every day to focus solely on what truly matters.
No more negativity and noise, just the science of the economic rent and the timing inherent in the real estate cycle.
This is all you need to succeed.
So, while the market appears to be doing what it’s supposed to, we all know the elephant in the room.
The government will get involved here, simply to be seen to be doing ‘something.’ And yes, the peak of the land market in the US and elsewhere is still ahead of us, that journey will not be smooth sailing.
Interest rates could rise again, inflation could return, even higher than now? Plus the negative side effects I’ve shown you from previous government actions. Sound advice on the timing of all this and clear, succent guidance to assist in navigating what lies ahead is paramount.
That’s how the BBB can help.
As a Boom Bust Bulletin member you will receive 12 monthly editions a year detailing all the key turning points of the cycle, a deep dive into the most important markets across the globe and ways that you can personally benefit from this knowledge.
All derived from our unique and proprietary research – which you’ll not find anywhere else.
Plus, you’ll receive exclusive invites to BBB member-only webinars when we run them.
All this for just US $4 a month, less than a takeaway coffee.
Best wishes,

Darren J Wilson
and your Property Sharemarket Economics Team
P.S. – If you would like to receive weekly updates like this, sign up here.
P.P.S – Find us on Twitter here and go to our Facebook page here.
This content is not personal or general advice. If you are in doubt as to how to apply or even should be applying the content in this document to your own personal situation, we recommend you seek professional financial advice. Feel free to forward this email to any other person whom you think should read it.