


If you would like to receive weekly updates like this, sign up here.
A recent report from US real estate-based company Zillow is the basis for today’s blog.
And it comes at an opportune time as well; the beginning of the 2nd half of the 18-6-year Real Estate Cycle. The most speculative half.
Recall the US leads the world into each separate real estate cycle, but also peaks first and then leads the rest of us into the inevitable bust too.
So, what is happening there is critical to determine what happens elsewhere, when it will happen and why.
Zillow’s report was a lengthy one, so I won’t go into extreme details but the basis of it should prove quite interesting.
And if you are still on the fence about just how much longer the current rise in land prices can last both here and around the world, you want to read on.
Let’s begin now as I show you some simply amazing data that correlates incredibly well with what we are seeing in the US real estate market.
And what it means for the rest of the world.
Why Today’s Housing Market Won’t Turn into 2008’s
Basically, Zillow’s report investigated why the housing market in the US today isn’t like the heady days of 2008.
The reason they gave is broadly in line with what did cause the price of land to crash. Once again, the knowledge the real estate cycle can give you would mean that once you read the report you would instantly note this.
But I digress.
However, what was mentioned about current levels of supply and increasing demand are spot on.
Another thing that was largely accurate too were identifying the drivers behind this. And they are driver we have covered here with you in the past.
Technology, demographics, access to credit, supply, and demand.
A quick search of any global real estate research company will provide you with charts like the one below.
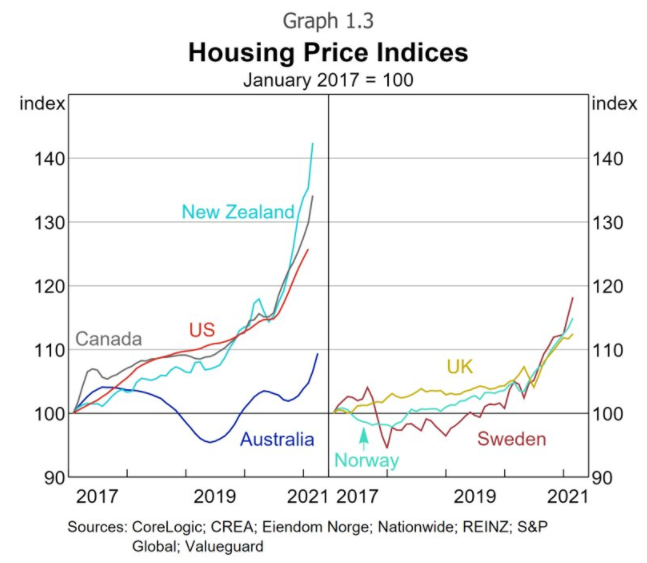
Source – CoreLogic
The property market (read land market) is going bonkers. To the point where it will become self-fulfilling and the need to not miss out continues to drive prices higher.
Back to the US, one aspect that goes largely unreported though is demographics, and the millennial generation. As of 2019 it is estimated they number around 72 million.
The oldest of whom are approaching their 40s, is aging into their prime career-building, family-starting and home-buying years. Take a look.
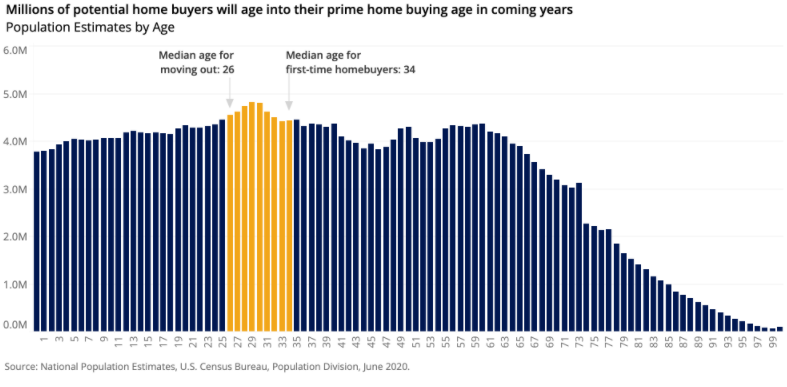
Source – Zillow
Note the yellow vertical band on the above chart.
This is the millennial age pyramid lying on its side. The yellow band represents the prime age profile of this group as they leave home, reach peak income earning years and finally first-time home buying.
The median (or average) age of first home buyers of this cohort is around mid-thirties. Over the next decade the number of millennials turning 34 is about 46 million.
Or 46 million more home buyers than there are in the market presently.
And these buyers are now coming out of a period of stagnant wage growth and large student debt and are ready to partake in the American dream.
Further to this, it is becoming very apparent, across the globe really, the COVID related shutdowns that most economies went through last year created a shift in mentality. An awakening almost.
And that was, forced to work from home, most of these wage earners are now more comfortable than ever to continue this trend indefinitely, even if it is in most cases on a part-time basis.
And US companies are happy to oblige for their employees. This means it’s a new normal, not linked to lock down conditions. Now, being able to take your work wherever you please (up to a point) mean the option of moving further away from big cities to somewhere more affordable to buy is now achievable.
So, what is there to buy?
The glaring lack of homes available to buy relative to robust demand is probably the most visible (or invisible) trend defining the US housing market in 2021.
This mismatch between limited supply and sky-high demand is the single-largest factor driving home values up at a record pace, and the time homes spend on the market before selling to record lows.
Consider these facts; there were less than 1 million homes listed for sale nationwide in March (966,970), down 1.1% from February and 32% from March 2020 — the 18th straight month of annual declines.
And the 12th consecutive month those declines have exceeded 10%.
You can see that building is desperately needed. The homeowner vacancy rate was just 0.9% in Q1 2021, tied for the lowest single quarterly rate, prior to 2020, since 1978.
The last time the homeowner vacancy was as low as this it was in 1957. When there are so few vacant homes to sell and potentially add to supply, building needs to fill much of the void.
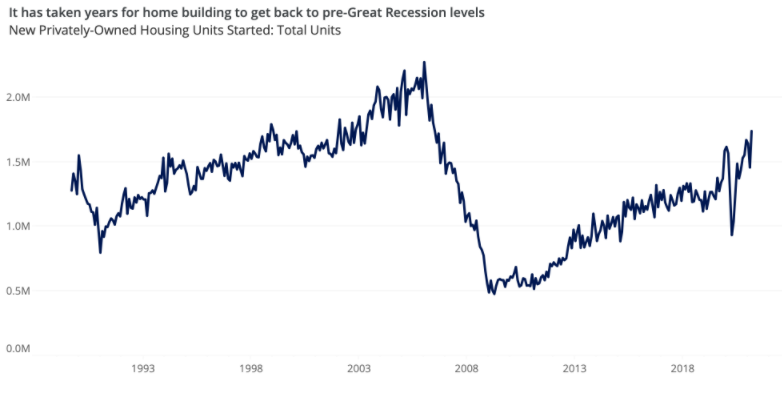
Source – Zillow
Shorter term, the COVID lockdown affected the sale of existing stock. Not only were prospective vendors reluctant to expose themselves to the health risks of open homes, but they weren’t even sure if they could buy a replacement house themselves.
Add it all up; supply is nowhere near meeting the demand for it, arguably for years.
Builders are ramping up activity to levels not seen since prior to the Great Recession. Home building is not a particularly fast-moving process, and it will take time for builders to fully make up a years-long building deficit — especially as the costs of land, labor and especially lumber and other key materials keeps rising.
But builder confidence is near all-time levels, the permit pipeline for future projects is strong and sustainable housing demand is a big reason for this change in fortunes.
And then there are interest rates.
The obvious one now, the fact that short term cash rate around the world are basically at zero means the average mortgage rate is at historic lows.
Clearly this has been an enormous help for both the recovery out of COVID related lows and to assist first time homebuyers onto the property ladder.
Much like it is here in Australia, across many states of the US its now cheaper to pay back a home mortgage than it is to rent.
Which is clearly accelerating an already hot property market.
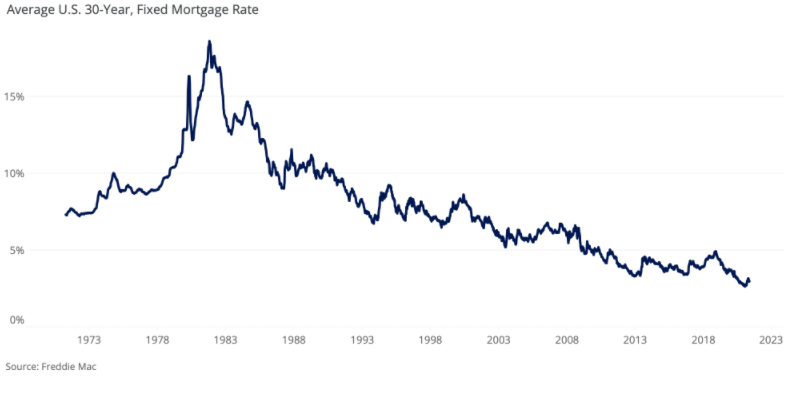
Source – Zillow
The beneficial impact of low rates is obvious, but it’s also critical to acknowledge several important realities — namely, that low mortgage interest rates don’t do anything to help buyers clear the largest hurdle to homeownership: saving for a down payment.
As home prices have grown, so has the amount necessary for even a minimal down payment. In this sense, continued job growth and income gains (particularly among today’s renters aiming to become tomorrow’s buyers) will be essential to ensure savings rates stay sufficient to keep the pipeline of buyers full.
So, this is the picture in US property right now, but what about next year? Or two years down the road, or several?
What fate awaits the more than 2 million homeowners in forbearance? Or the approx. 4 million renters at risk of eviction? What if demand eventually overtakes supply, what will happen to home prices then?
This is why the Boom Bust Bulletin can help. By studying the history of the 18.6-year Real Estate Cycle and why it must repeat, you will learn how to chart the way forward for the world most important market.
And more importantly, understand how it can be a lead indicator for what’s next in markets outside the US. You can then prepare properly for the opportunities that present and protect yourself and your investments once the downturn commences.
We are at a critical juncture now; many long-term economic drivers are converging to ensure this will be the greatest boom ever.
Do not allow yourself to miss out.
And all this for a few cups’ worth of coffee a year, amazing value!
So don’t wait, sign up now.
The US housing market has spoken, the rest of the world will fall into line and follow.
Let us help guide you on this journey.
Best wishes,

Darren J Wilson
and your Property Sharemarket Economics Team
P.S – Find us on Twitter under the username @PropertySharem1
P.S.S – Go to our Facebook Page and follow us for right up to date information on the 18.6-year Real Estate Cycle.