


If you would like to receive weekly updates like this, sign up here.
To understand what’s to come, it is wise to reflect upon what has just occurred.
That was driving force behind Property Sharemarket Economics (PSE) release of its ‘2021 Year in Review’ email expertly put together by PSE Director Cathy Stacey.
As we begin 2022, its the best opportunity to review what has been an interesting and unusual year.
And for you, today, I am doing something I’ve never done before.
I’m going to show you what I – and my co-writers at PSE – actually do for their members.
The astounding foresight you can get by looking back at history – but only if you know how to look. You can click here to access the full report.
You may find this a bit hard to believe.
So I thought I would start with two graphs.
W.D. Gann, one of the world’s foremost traders of all time, used his Dow Decennial cycle to determine the general characteristics of each year within each decade.
His cycle work meant that market performance in 2021 should not have been unexpected.
History shows that years ending in 1 tend to be volatile and/or recessionary from an economic perspective. With much disruption.
Go back and have a look: 2001, 1991, 1981 and so on back through the years. They’ve all been the same the years ending in 1: difficult economic years.
However, they set the stage for much of the rest of the decade. 2021 was no different.
In this special email to you, I’ve looked back at some of the Property Sharemarket Economics (PSE) exclusive member updates.
And prepared a handy and succinct summary of how we’ve fared with our forecasts: our read of happenings globally and suggested market movements. Click here to access the full report.
Here are those two charts I mentioned.
Taking a leaf from the volume of work left by Mr Gann, PSE prepared it’s forecast of the US markets and the Dow index for 2021. This was released to PSE members at the start of January, last year.
Here’s that forecast. (It’s a specially prepared chart, using history in set time frames, to give members an idea of the likely shape of US markets for 2021. Remember, this was produced at the start of the year.)
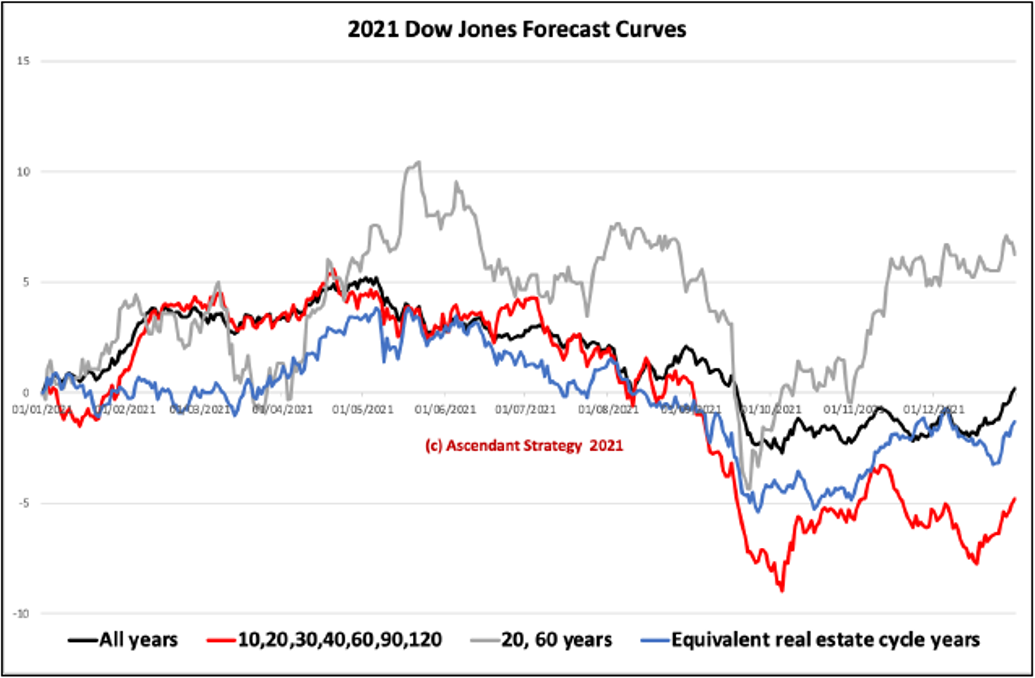 Source: Property Sharemarket Economics 2021 RoadMap.
The forecast method suggested an early May 2021 top and a September 2021 equinox low.
Here’s what the Dow Transportation Index did in 2021.
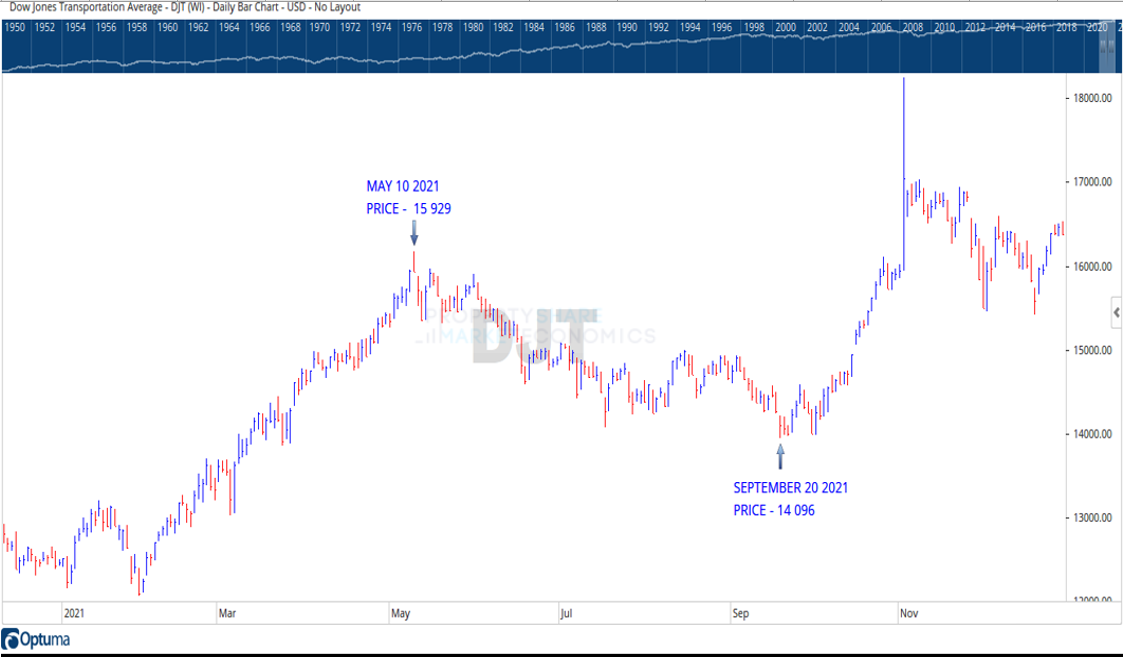 Source: Optuma
An early May 2021 top and a September 2021 equinox low.
That’s astounding isn’t it?
History repeating in set timeframes. Click here to access the full report breakdown.
Inside that report you’ll see the following.
- Review of the 2021 Stock Market Roadmap and the type of email updates that PSE members received throughout the year.
- Breakdown of Akhil’s Gold report for 2021 with charts.
- Our ongoing commentary of the UK real estate market.
- Phil’s email updates on seasonal times, which aligned with Akhil’s mid-year roadmap update.
- Akhil’s October report which broke down the Chinese property developer Evergrande troubles and why it was ‘a media beat-up.
- November update on inflation, both the near-term outlook and for the remainder of the cycle.
- All the tools and reports we produced during 2021 to help members bring all this together to take best advantage.
Out of respect to our current members, all links on the PDF report have been removed.
Best wishes,

Darren J Wilson
and your Property Sharemarket Economics Team
P.S. – If you would like to receive weekly updates like this, sign up here.
P.P.S – Find us on Twitter here and go to our Facebook page here.
This content is not personal or general advice. If you are in doubt as to how to apply or even should be applying the content in this document to your own personal situation, we recommend you seek professional financial advice. Feel free to forward this email to any other person whom you think should read it.