


If you would like to receive weekly updates like this, sign up here.
Most of the stocks in your portfolio are duds!
Sound controversial? Perhaps it is. Perhaps not, however.
Today we will look at the results of a recent study that came to some amazing conclusions.
Such that, most US and global stocks not only make little money across the measured time period but lose money in the long term.
And that you would have been better off holding 1-month Treasury Bonds!
How is that possible?
You should be worried that your own portfolio may be filled to the brim with these dud stocks.
Which then leads itself to the obvious question; “how does one find the stocks this study found were not duds?”
It’s an incredibly important question, particularly at this stage of the real estate cycle.
Read on now, as we break down this study.
Moon-shot Investing
Google defines a moon-shot as the following.
“A project or proposal that: addresses a huge problem, proposes a radical solution and uses breakthrough technology to achieve it.”
Ok great, well I need to invest me in some of those you might think.
In a 2017 draft called “Do Stocks Outperform US Treasury Bills?”, author Hendrik Bessembinder showed that despite the US equity market’s gains over the past century, most stocks are duds.
In fact, of the roughly 26,000 US companies listed between 1926 and 2016, more than half lost money or did worse than simply holding 1-month Treasuries.
In contrast, about 1,000 stocks – or just 4 percent of the entire sample – in practice accounted for all the net wealth creation over the period, or almost $35 trillion.
Ok wow, that’s actually bad!
Well folks, it gets worse!
While we are focused on stocks in today’s blog, don’t ever forget the enormous advantage that knowledge of the 18.6-year Real Estate Cycle can have on those of you who rely upon technical analysis to trade or invest in stocks.
Click here to read PSE director Phillip J Anderson’s contribution to IFTA’s (International Federation of the Technical Analysts) 2010 journal (refer page 22).
In 2019 follow-up to that draft, Hendrik then decided to include international stocks into his research.
In this version, he found the results even more stark; 61% of non-US stocks couldn’t outperform short-term Treasury Bills between 1990 and 2018.
Less than 1% of them contributed to the estimated $16 trillion of created wealth in that same period.
Let me break this down for you, so you understand the results.
Between 1990 and 2018, if you were choosing stocks for your portfolio, you’re 61% more likely than not select ones that would return you less than a short-term bond.
Or, if I can be blunter…
… The wealth created by stock market investing comes down to essentially a handful of stocks.
If you cannot identify the few stocks that will create the most wealth, then the rational thing to do is to just put your money into passive index tracking funds.
On the other hand, for the (presumably few) investors who know what to look for, the results highlight the degree to which successful stock selection can massively enhance your wealth.
The stark reality is you can spend your entire investing life and not own of these “moon-shot” stocks.
And yet, life-changing gains can be secured by having one or two of them in your portfolio long term.
The question now is obvious: How does one find them?
When others panic, you do this instead.
We go back to 1930, and the release of WD Gann’s book “Wall Street Stock Selector”.
Even though we are approaching 100 years since it was first published, it still to this day remains one of the best books you can read about active investing.
From page 129 of chapter 8.
“In every group of stocks there are always some that are in a weak position and some that are in a strong position…”
Therefore it is necessary to determine the stocks which are in a strong position and will become leaders…”
Gann then proceeds to show how via examples of the 1921 to 1929 bull campaign. What does he mean by stocks in a “strong position”? Let me illustrate by using an example from last year. Let’s start with the three main US indices: the Dow Jones, the S&P 500 and the NASDAQ.
All three bottomed on the same day, 23rd March 2020.
But as these markets moved up in April, both the Dow and the S&P 500 retraced to make a higher bottom, whereas the NASDAQ simply continued to climb higher. See the chart below.
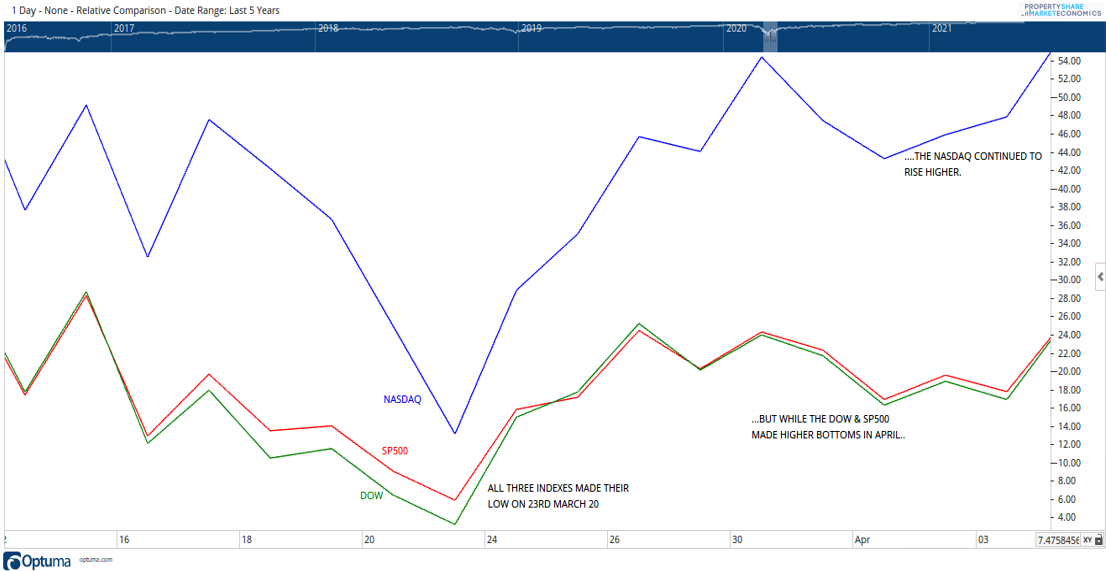
Source: Optuma
It was already apparent then, that the NASDAQ was the index leading the US out of the COVID market lows of March 2020.
Which mean that tech stocks in general were the place, per Gann’s advice, that we would look for to identify the “strongest”, best performing stocks.
And, lucky you, I did the hard work for you!
I found the top dozen or so best performing NASDAQ stocks for the month of March 2020. I then placed them in a relative comparison chart along with the NASDAQ index itself. (Click the chart below and open it in your preferred browser so you can see).
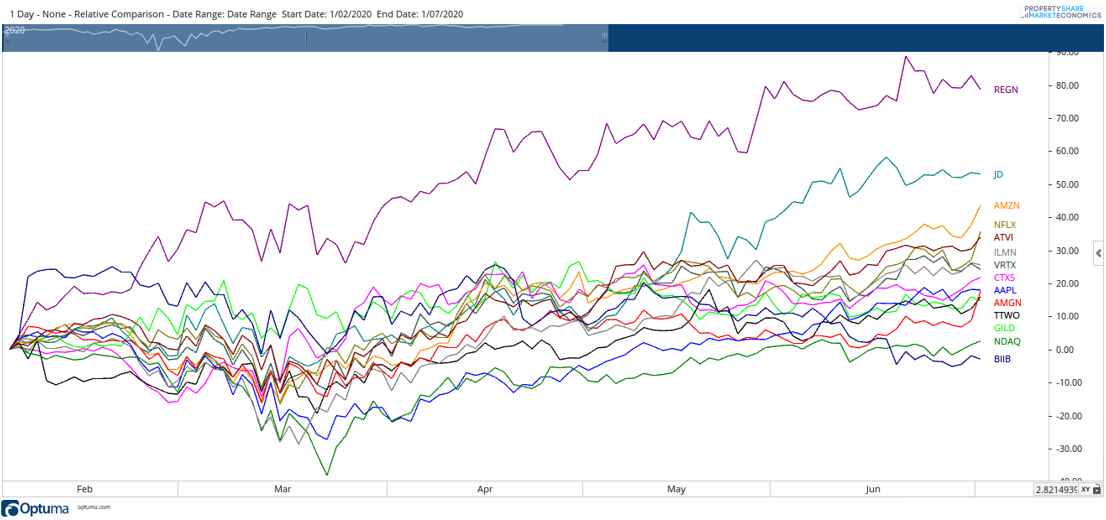
Source: Optuma
Now, what if we looked at which of these stocks bottomed before the NASDAQ itself did and then continued higher. Might these be the leading stocks we are after?
By doing so, we have six obvious candidates.
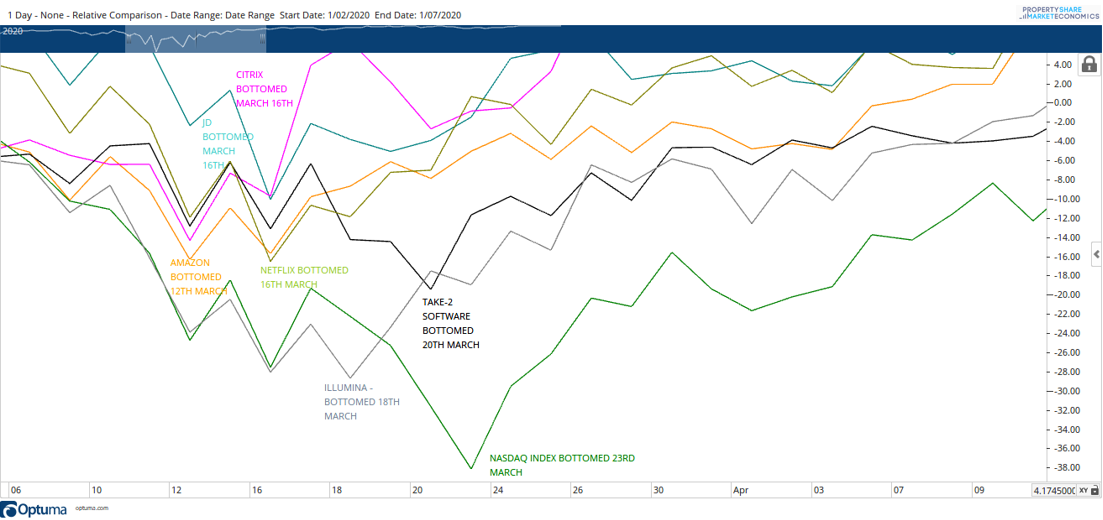
Source: Optuma
Can you see how we find stocks which bottomed first, before the index, and then continued up, without really coming close to retesting their March lows.
This is what we call “leading stocks”.
You can make a good argument then that businesses like Amazon are no brainers, that due to their size and importance they will be right up there when we look back to which stocks performed the best this upcoming decade.
I would have to agree.
But here’s the point. There are stocks here you’ve arguably never heard off.
What were you doing back in March 2020? Were you caught up in all the social media driven panic and news story sensationalising the COVID lockdowns?
Or were you doing the above?
If you want average returns, be average. Personally, I think we need to be much better than that, we need to be smart and rise above that. Work hard and smart to position ourselves for success.
Remember, this is how we can find “moon-shots”, those 1% that will make the lifechanging returns.
And the good news is, there is another Gann rule which we can use to drill even further down and determine exactly “which” of the 6 stocks above have the highest chance of being a moon-shot business.
Interested?
That’s my Boom Bust Bulletin.
It will teach you the history of the 18.6-year real estate cycle, why it repeats, and help guide you to the opportunities as they present, all at the right time.
Future editions of the Boom Bust Bulletin will look much more closely at what Gann had to teach us about the stock and commodity markets.
The market will tell you in advance which are the best stocks to own over the course of the cycle, so long as you have the right tools at your disposal.
Don’t you think that kind of information would be of benefit to you?
Join us on this journey, get yourself educated and all for a few cups of coffees a year.
Incredible value.
Best wishes,

Darren J Wilson
and your Property Sharemarket Economics Team
P.S – Find us on Twitter under the username @PropertySharem1
P.P.S – Go to our Facebook Page and follow us for right up to date information on the 18.6-year Real Estate Cycle.